Aggregated dashboard analytics
The data on the dashboard page collates the data across all your candidate packs, giving you an unified view.
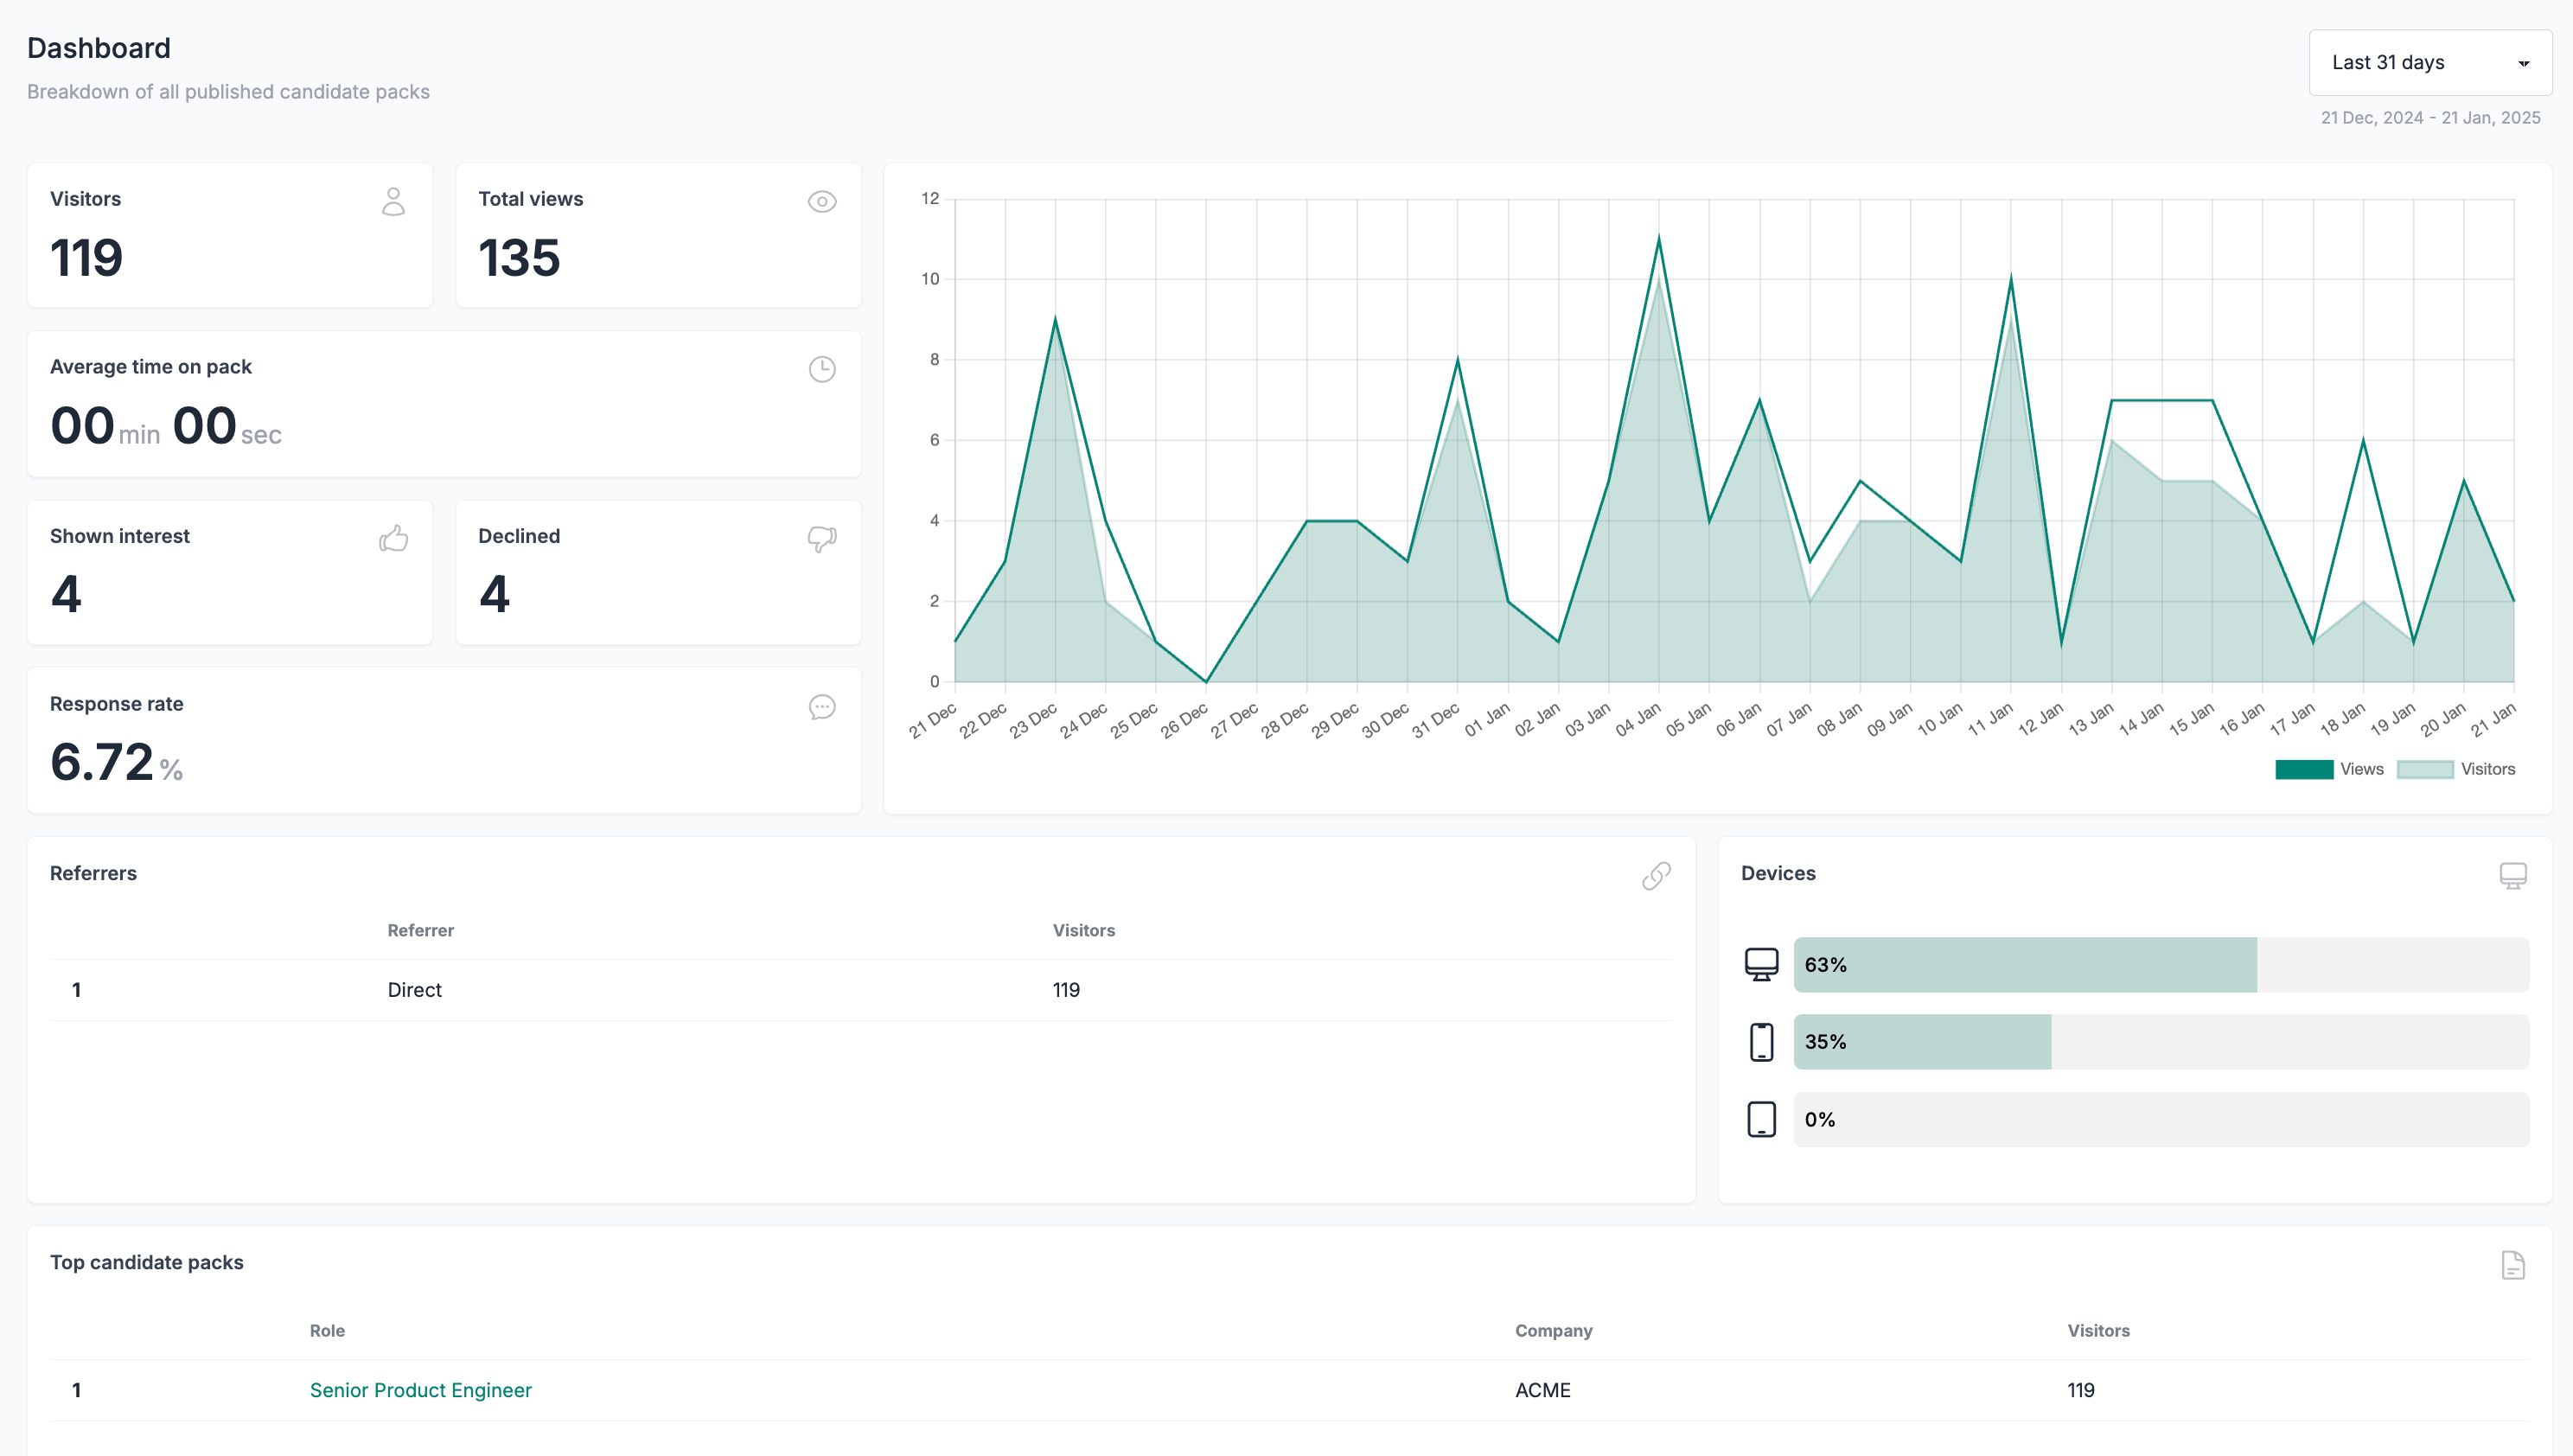
You can view the aggregated data spanning across:
- Last 24 hours
- Last 7 days
- Last 31 days
Visitors
The sum of the unique visitor counts recorded for each of your published candidate packs during the selected time period. A person who visits multiple packs may be counted once per pack; this total is not deduplicated across packs.
Total views
The total number of views (including returning visitors) across all your published candidate packs, for the selected time period.
Average time on pack
The average time visitors spent across all your published candidate packs, for the selected time period.
Shown interest
The total number of candidates that shown interest, across all your published candidate packs, for the selected time period.
Declined
The total number of candidates that declined, across all your published candidate packs, for the selected time period.
Response rate
The response rate is calculated as shown interest plus declined, divided by the visitor total above, across all your published candidate packs, for the selected time period.
Referrers
A list of the values recorded in the utm_source parameter for traffic to your candidate packs during the selected time period. These are tracking labels, not referring websites or domains.
Devices
A list of all the devices the candidate packs were accessed from, grouped by desktop, tablet and mobile.
Top candidate packs
A list of your top performing candidate packs, ordered by number of visitors.